Application management
Statistics
System

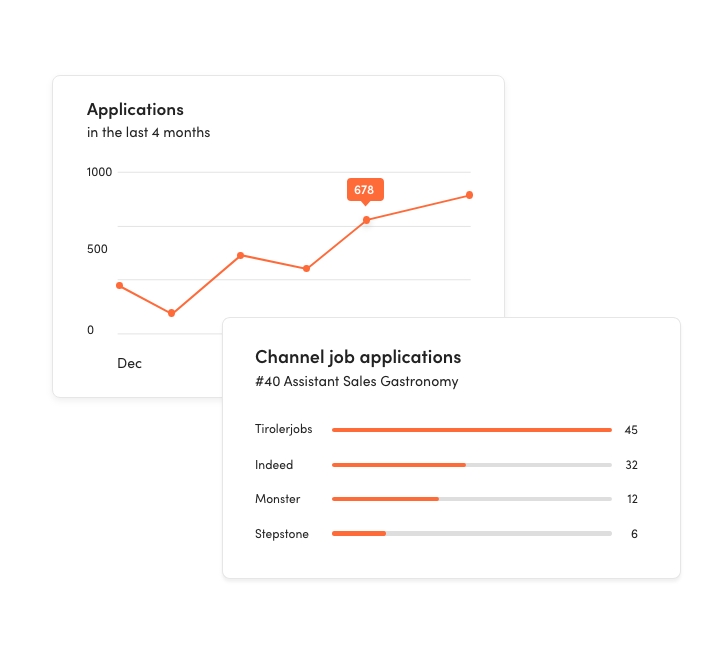
Effective data visualization
The statistics system gives you a clear overview of key recruiting figures such as applicant response or channel effectiveness. You can create individual filters and charts to evaluate the data according to your needs. It is also possible to compare different time periods, for example performance compared to the previous year.

Optimal use of resources
Recruiting key figures are crucial for working efficiently and transparently and optimizing applicant management in such a way that specialists can be successfully recruited. With the help of statistical analyses, you can not only identify potential for improvement at an early stage, but also make optimum use of your resources.
Do you have any questions about INJOBS or would you like to arrange a demo? Then contact us now.
Contact
![[Translate to English:] [Translate to English:]](/fileadmin/_processed_/4/b/csm_INJOBS_Contact-Image_9fde6c5a1e.jpg)
Do you have any further questions?
INJOBS is a modern and convenient application management software for optimizing the recruiting process that places great value on the security of your data. The great advantage of HR software is that it minimizes the time spent on administration and centralizes the stored data. INJOBS actively supports you in the day-to-day management of application data, job advertisements, onboarding, contracts, appointment management and transparency in the administration of communication with the applicant. INJOBS also takes care of a GDPR-compliant data storage process in the background and protects your application data through various security mechanisms.
INJOBS is suitable for small, medium-sized and large companies as well as corporate groups. Depending on the company, various additional features can be booked to make administration even more convenient.
INJOBS can be used across all sectors and is customized for your company during the initial setup. You receive user-defined job advertisements, occupational fields, application forms and much more. Everything is designed in the style of your company.
The implementation time varies, but is generally fast and efficient. On average, INJOBS is ready for use around 3 weeks after the contract is concluded. This time does not include the import of old application data or training courses. These must always be coordinated on a case-by-case basis.
We offer the possibility to book a Demo appointment to get to know the software. Our staff will be happy to go through the HR software with you to find out more about your needs and how INJOBS can help you.
An applicant management system simplifies and centralizes the entire application process, from candidate search to hiring, saving time and resources. It also creates transparency within the HR department so that it is possible to see what has been communicated with the applicant so far. Furthermore, new job advertisements can be easily created and published on various channels.